Datadog is a leading cloud-based monitoring platform that provides real-time insights into applications, infrastructure, and services. It helps teams track performance, resolve issues, and optimize operations with powerful dashboards, logs, and alerts.
Datadog’s illustration style is characterized by its brightness, futuristic elements, approachability, and sense of optimism.
As part of the Brand Design Team, I work on high-visibility projects spanning diverse scopes, developing illustration systems that enhance the brand. I collaborate closely with the marketing, writing, and product teams to conceptualize and produce illustration assets.
Role: Illustration, Iconography, Illustration System Design, Art Direction
Solutions Briefs Pages Hero Illustration
Solutions briefs landing pages are featured on the Datadog corporate. Each page is tailored to specific target audiences and covers a specific topic. The illustration below depicts Digital Experience Monitoring.

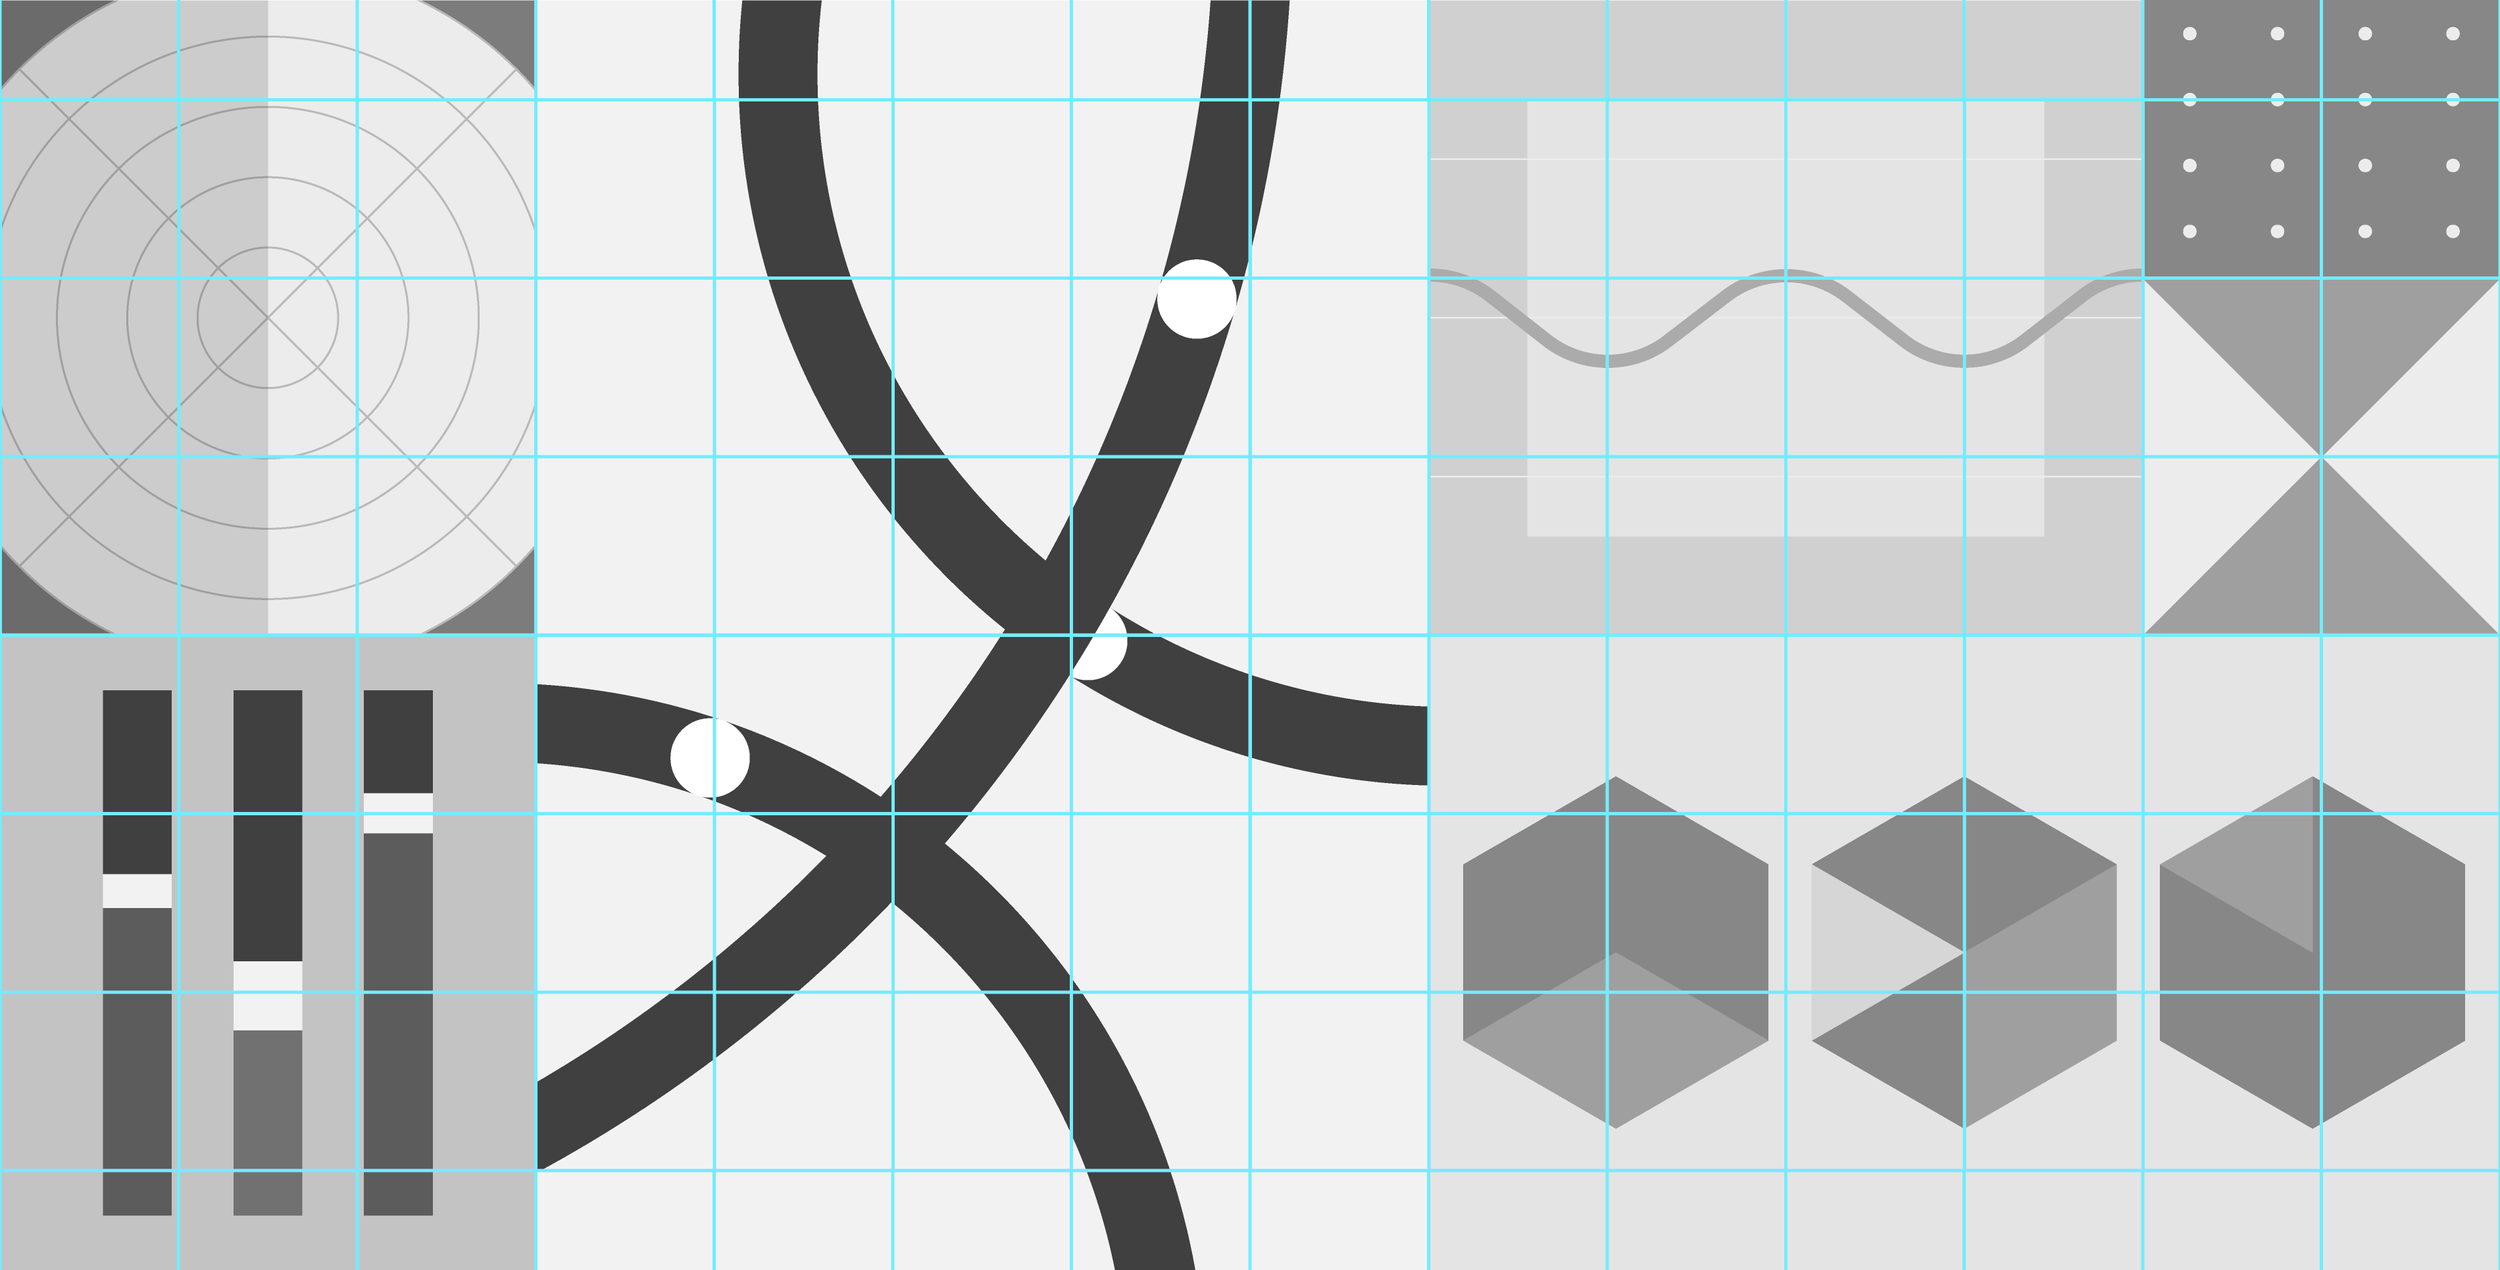
Pup Culture Illustration System Design
The Pup Culture blog highlights Datadog's culture, featuring industry events, campaigns, and outreach initiatives from the perspective of Datadog employees.
Challenge: I was tasked with creating a visually engaging illustration system that aligns with the Datadog brand, is easy to replicate, and can be adopted by team members of all skill levels while maintaining consistency.
Solution: I designed a modular solution that offers flexibility for integrating copy and customizing layouts.
Each illustration features a core visual representing the "Pup Culture" categories: office openings, employee highlights, and career pathing. The rest of the design incorporates data visualization-inspired geometric forms. This approach enabled the creation of an asset library as each hero is developed, streamlining the process of creating new heroes.


Report Infographic System Design
Datadog's annual reports provide insights into industry trends, performance benchmarks, and emerging technologies, helping organizations make informed decisions using Datadog's data and expertise.
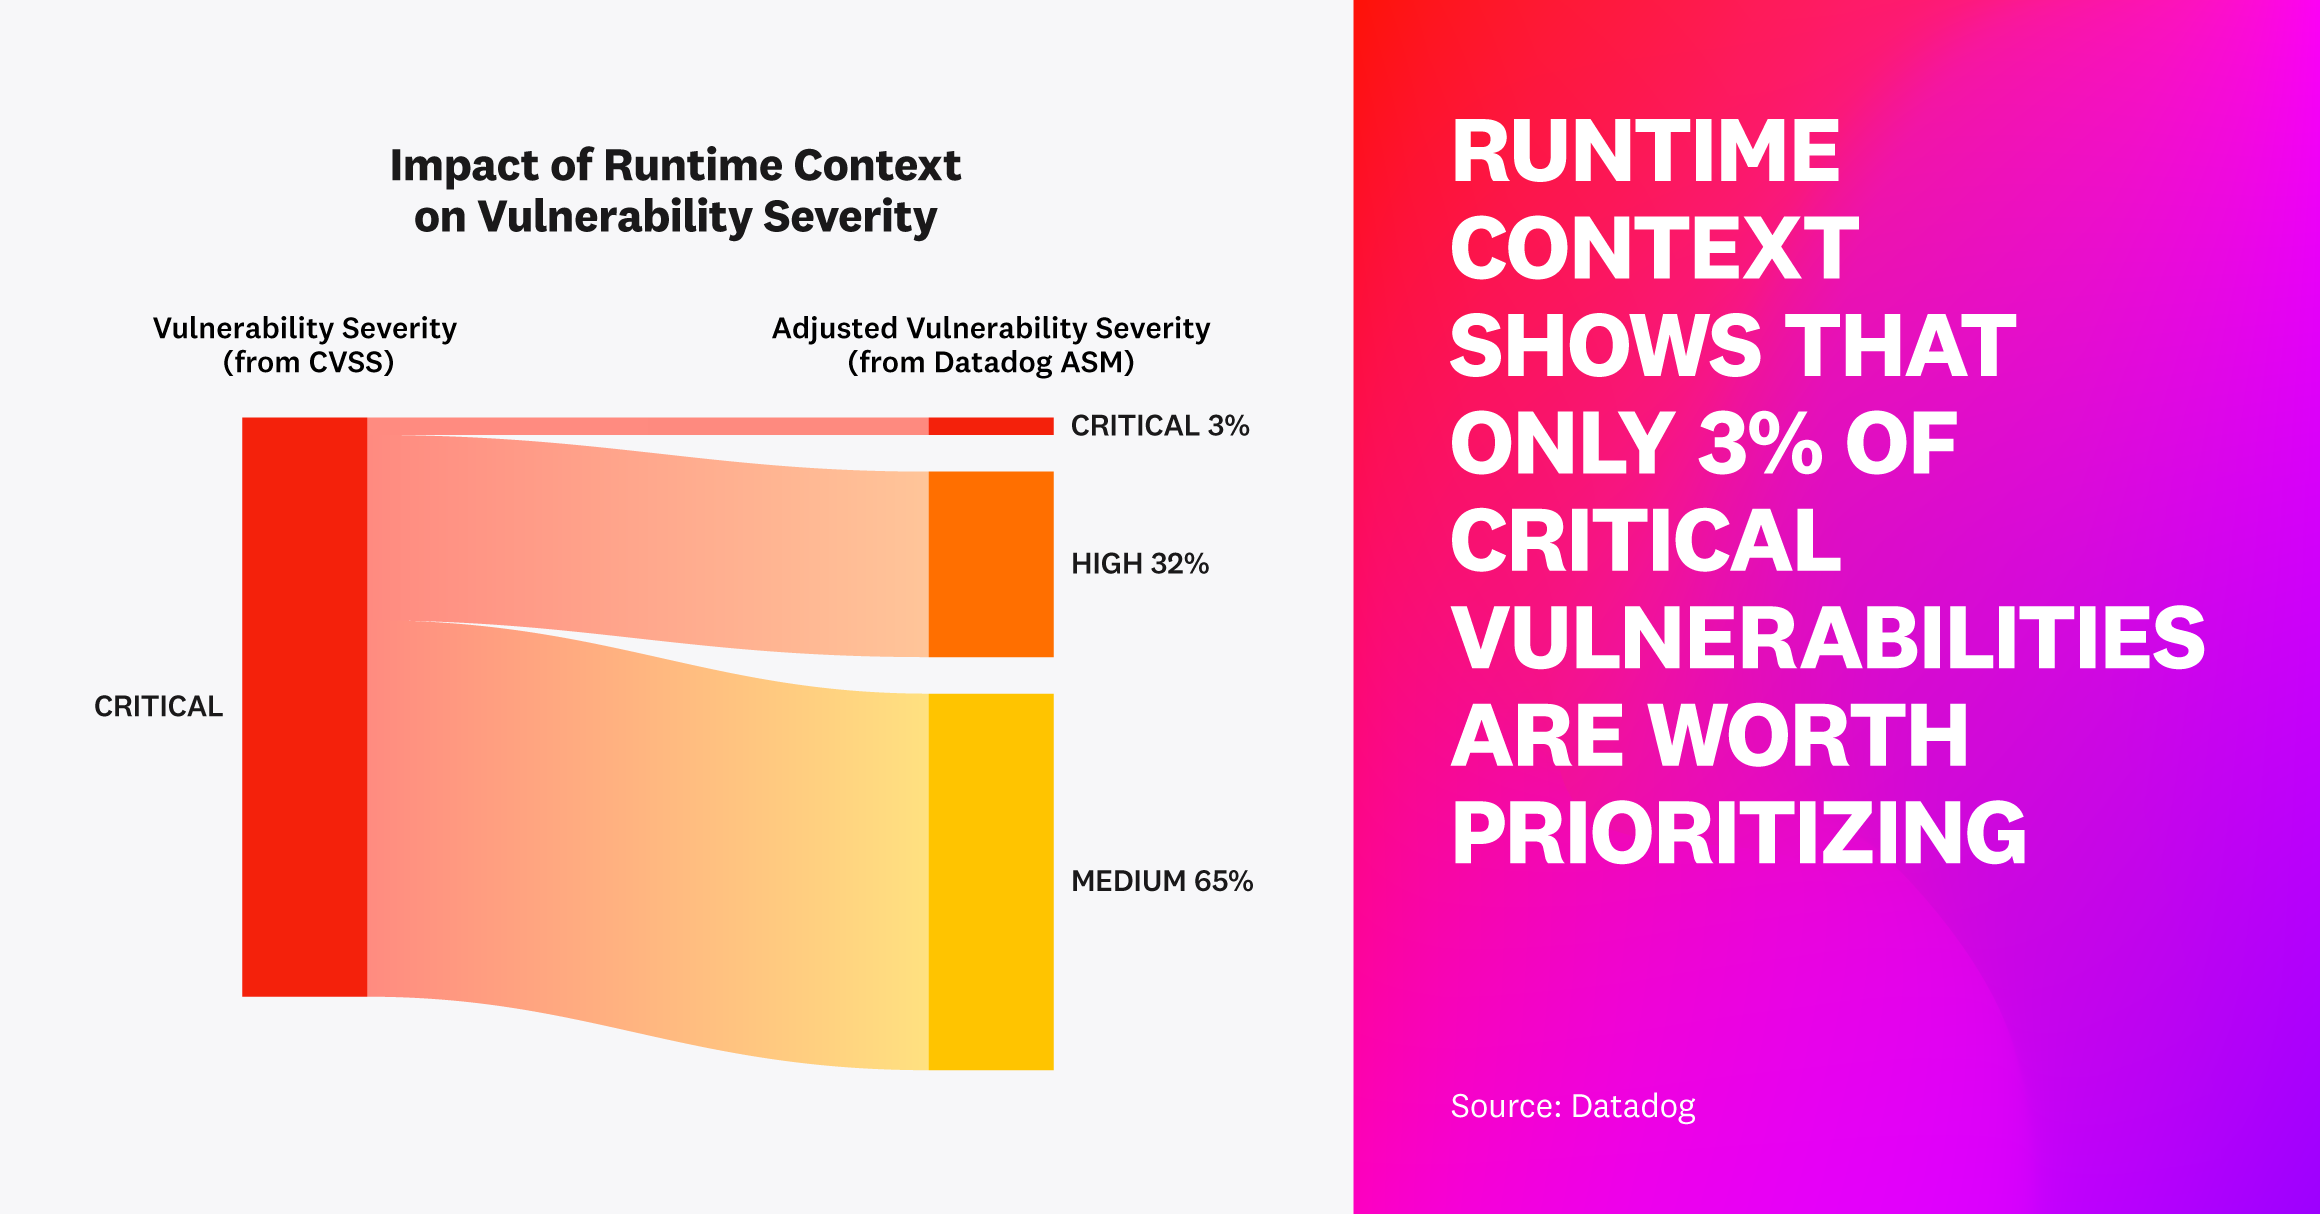
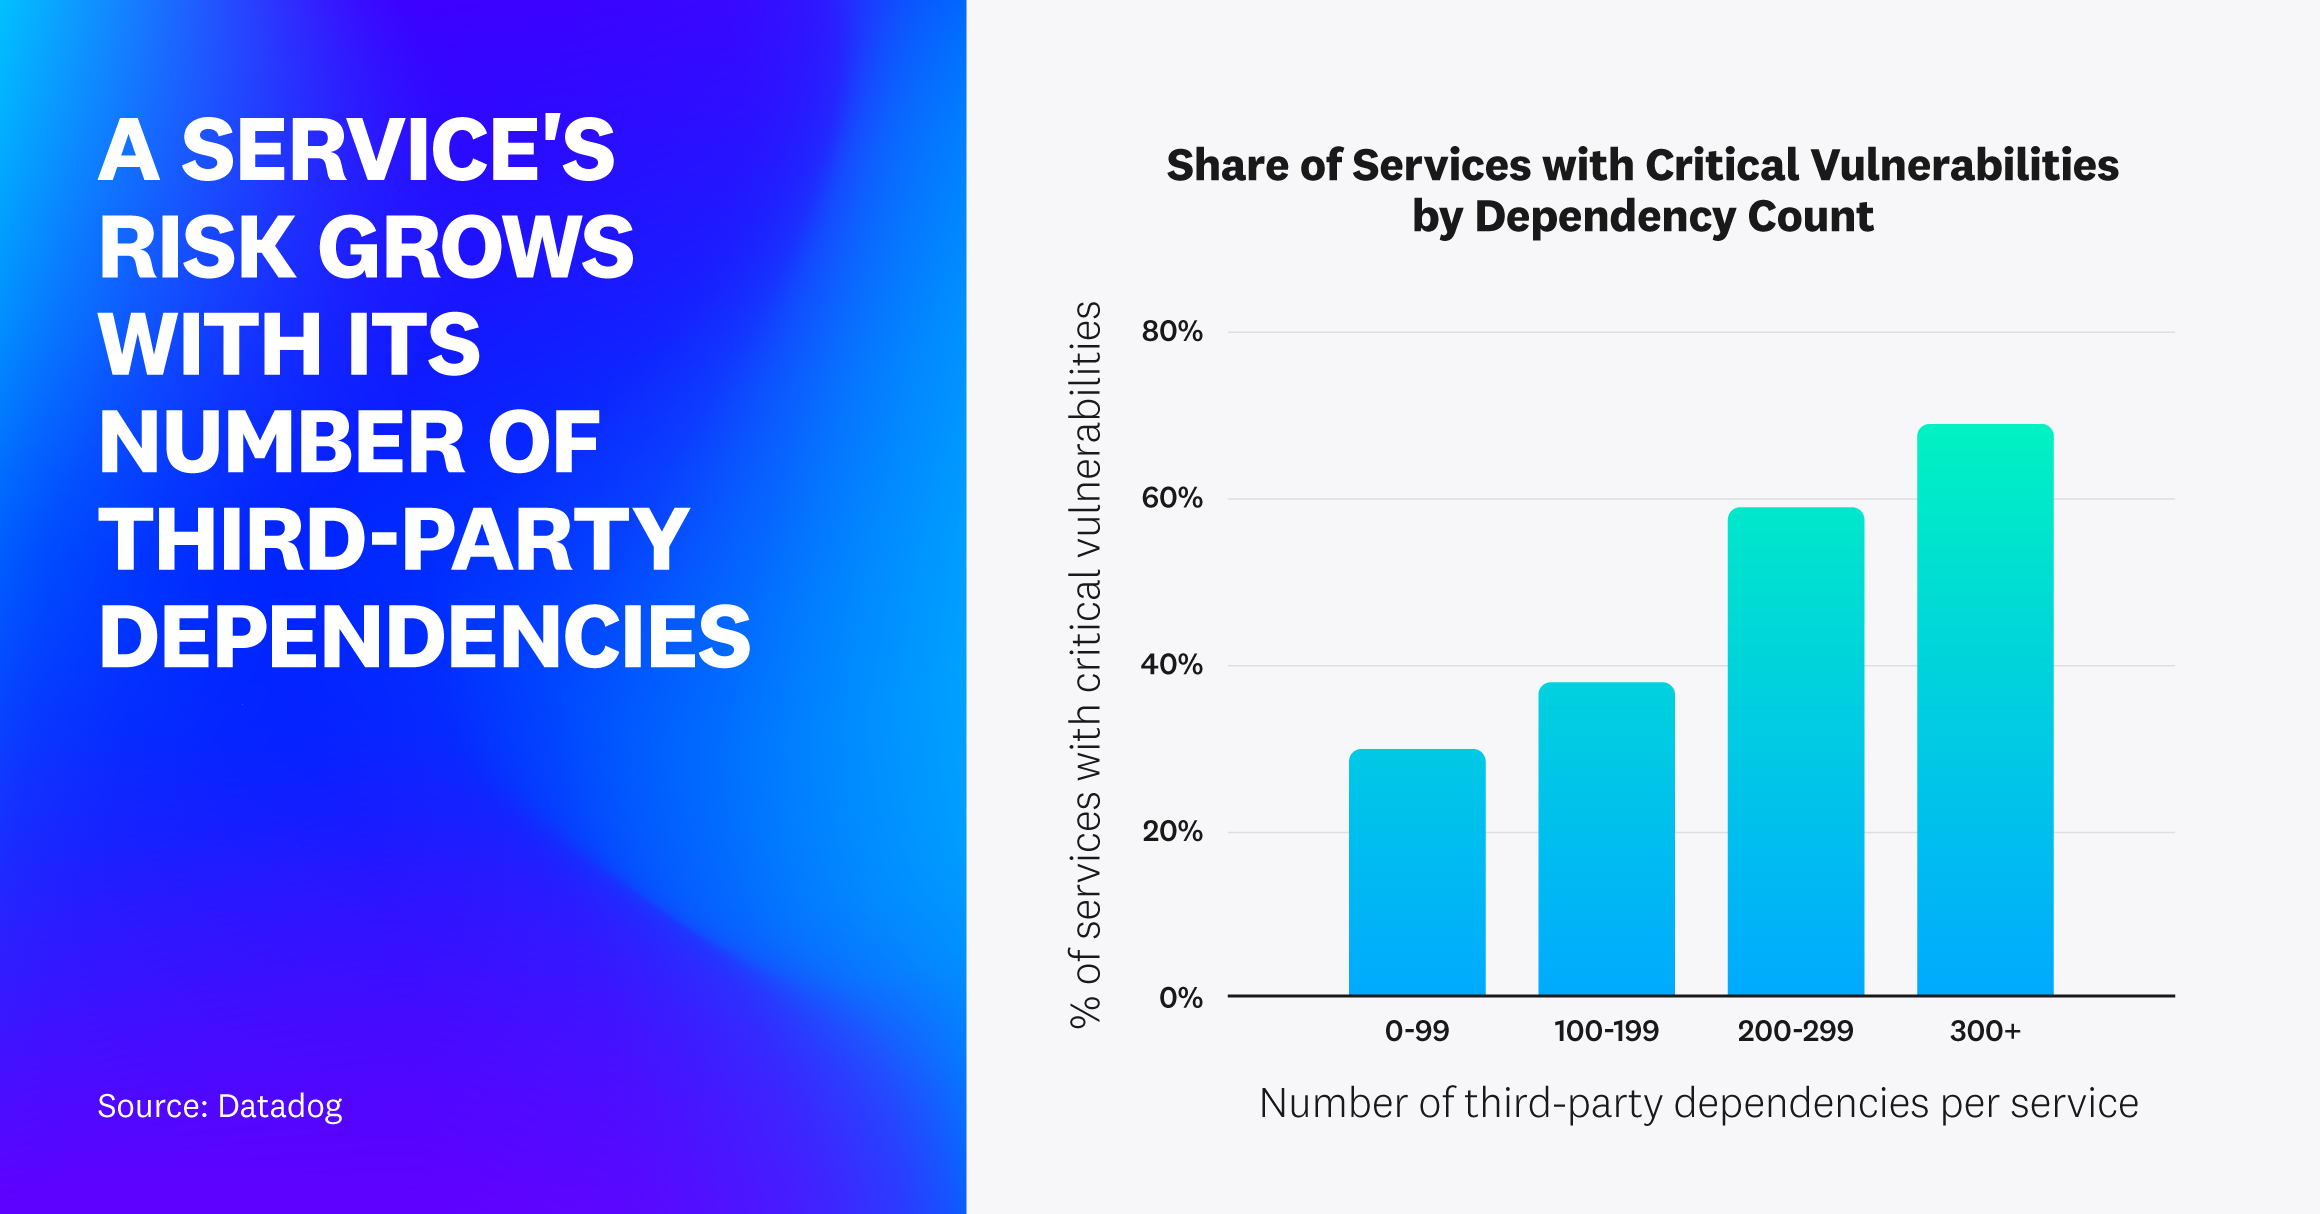
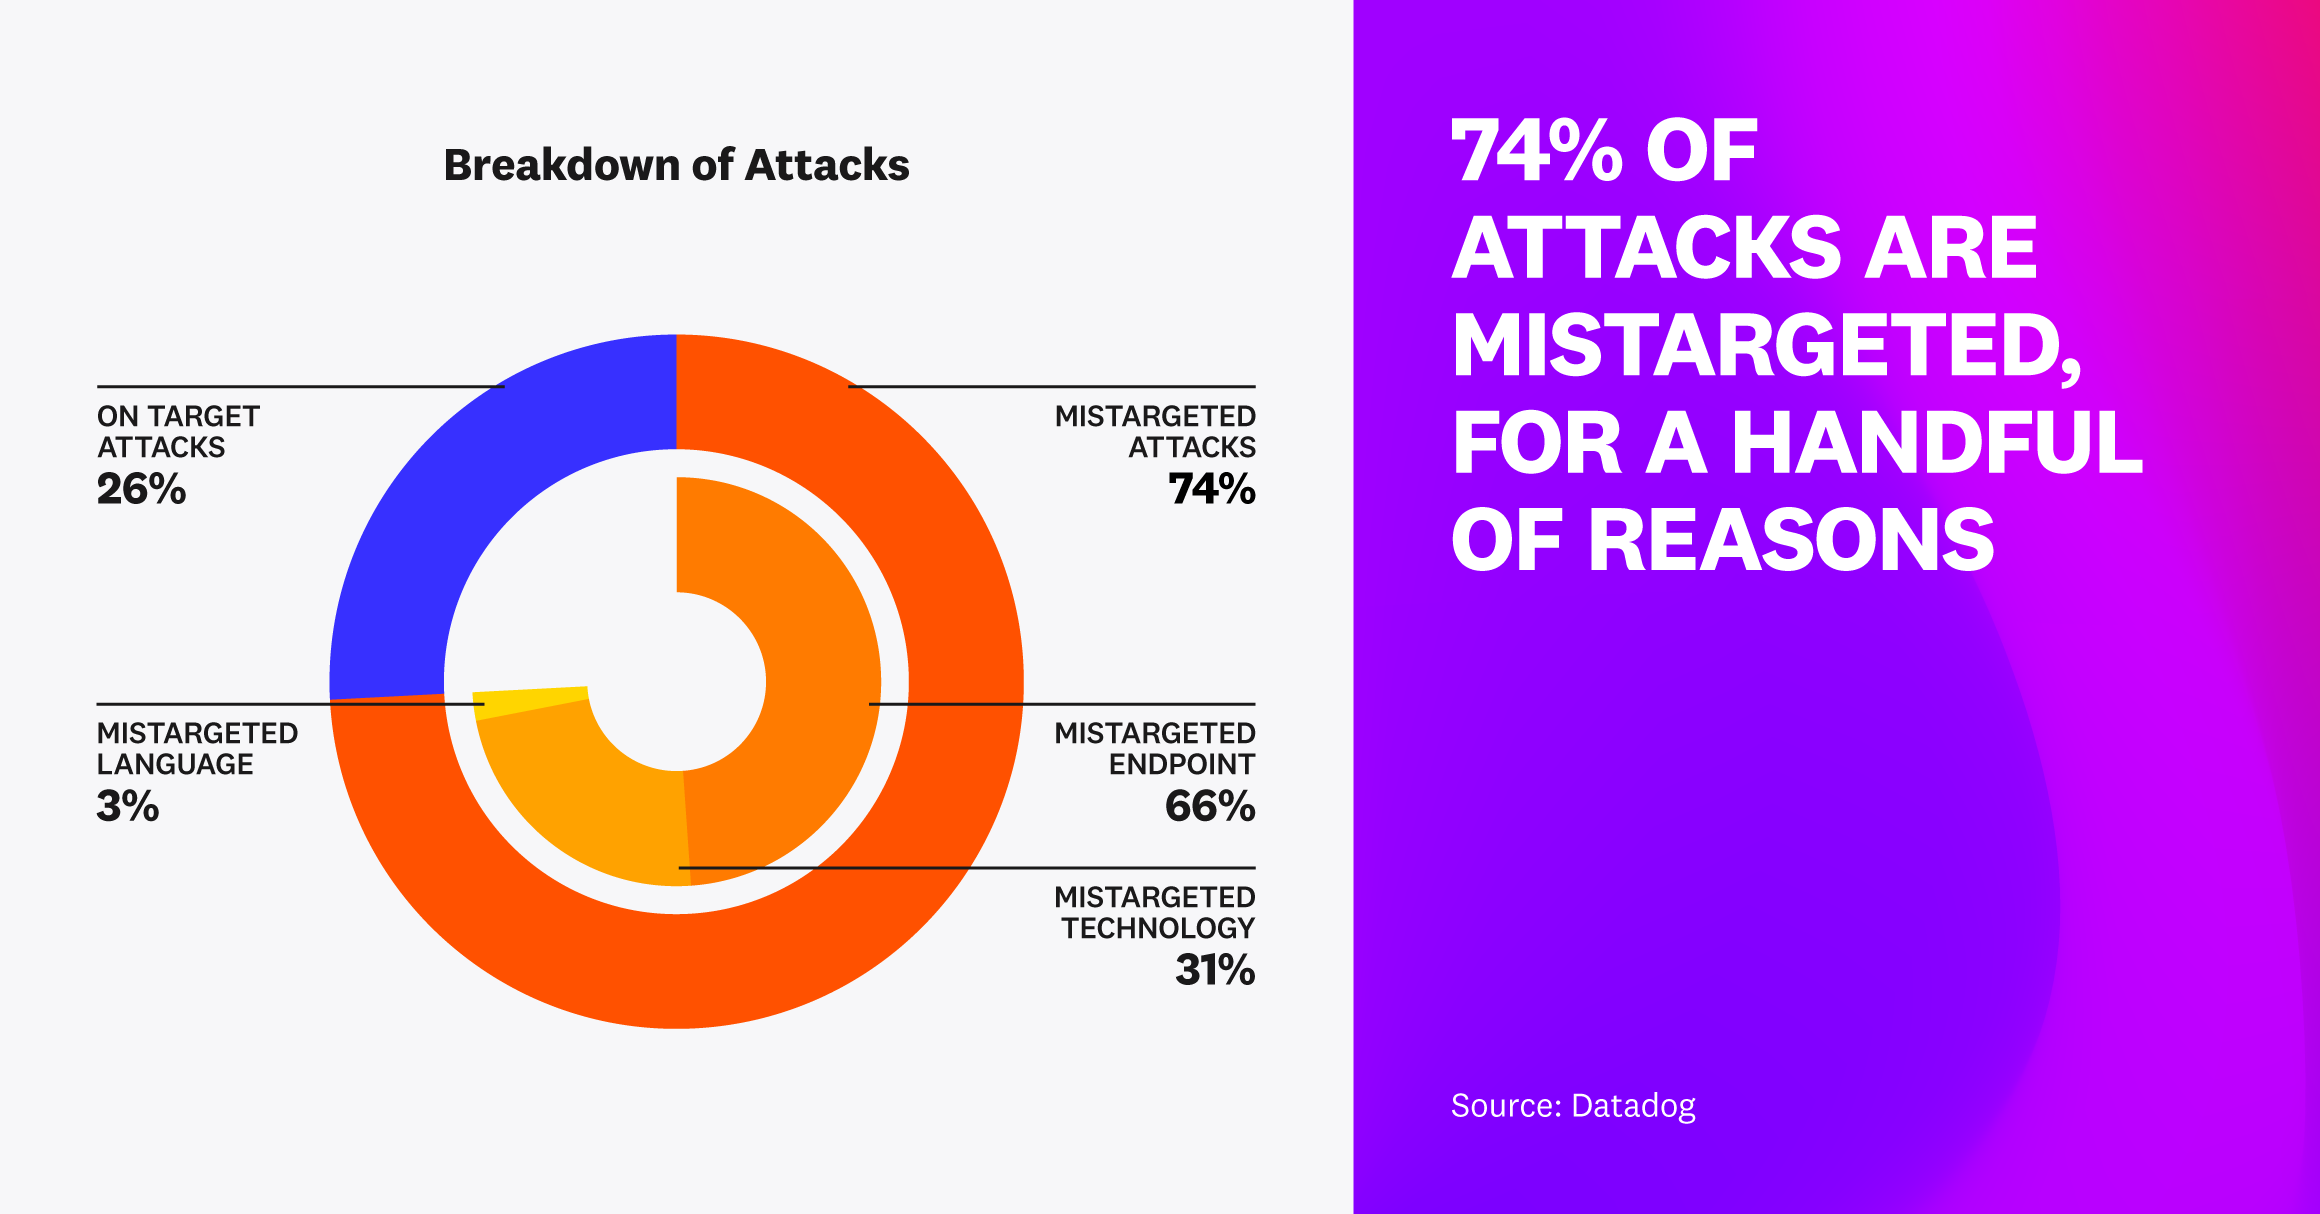
The infographic illustrations play a crucial role in Datadog's annual reports, transforming complex data and insights into visually engaging, easily digestible content.
Challenge: I was tasked with redesigning the infographic illustration system to make it more visually impactful and better aligned with current industry trends.
Existing Illustrations
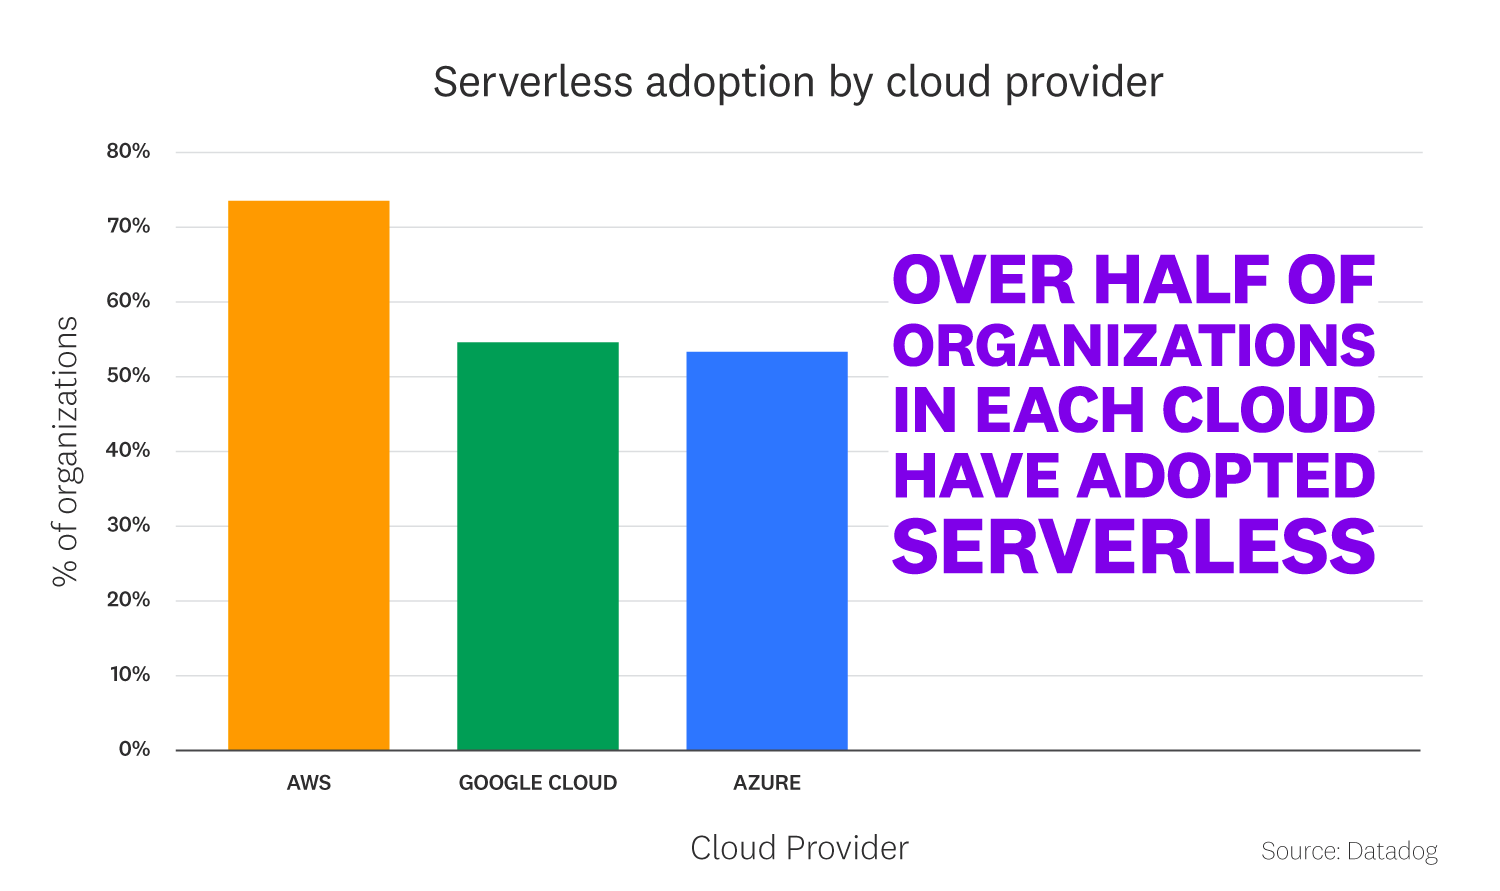
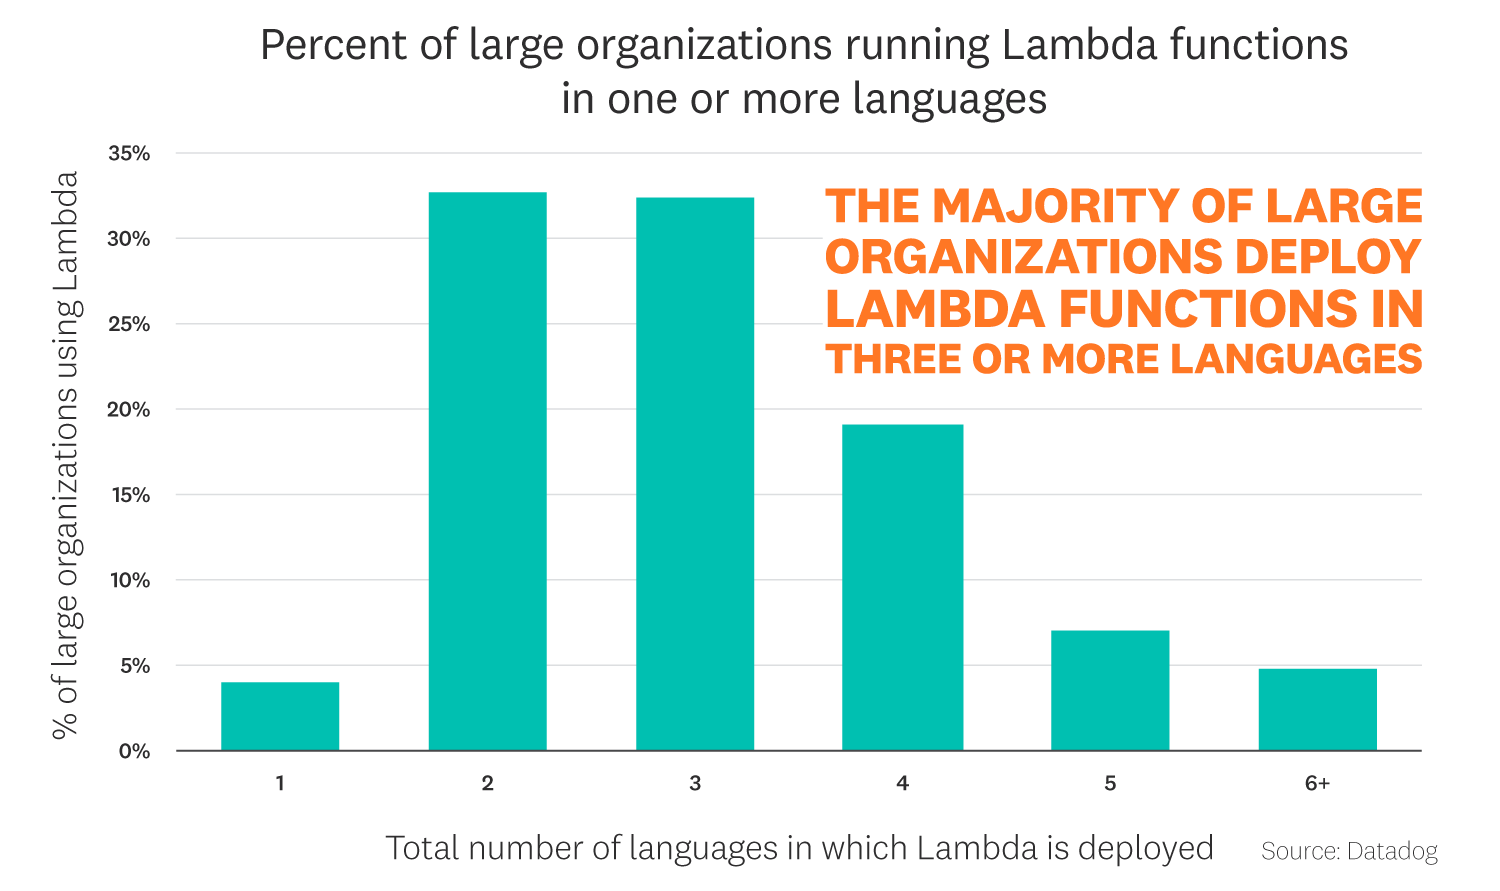
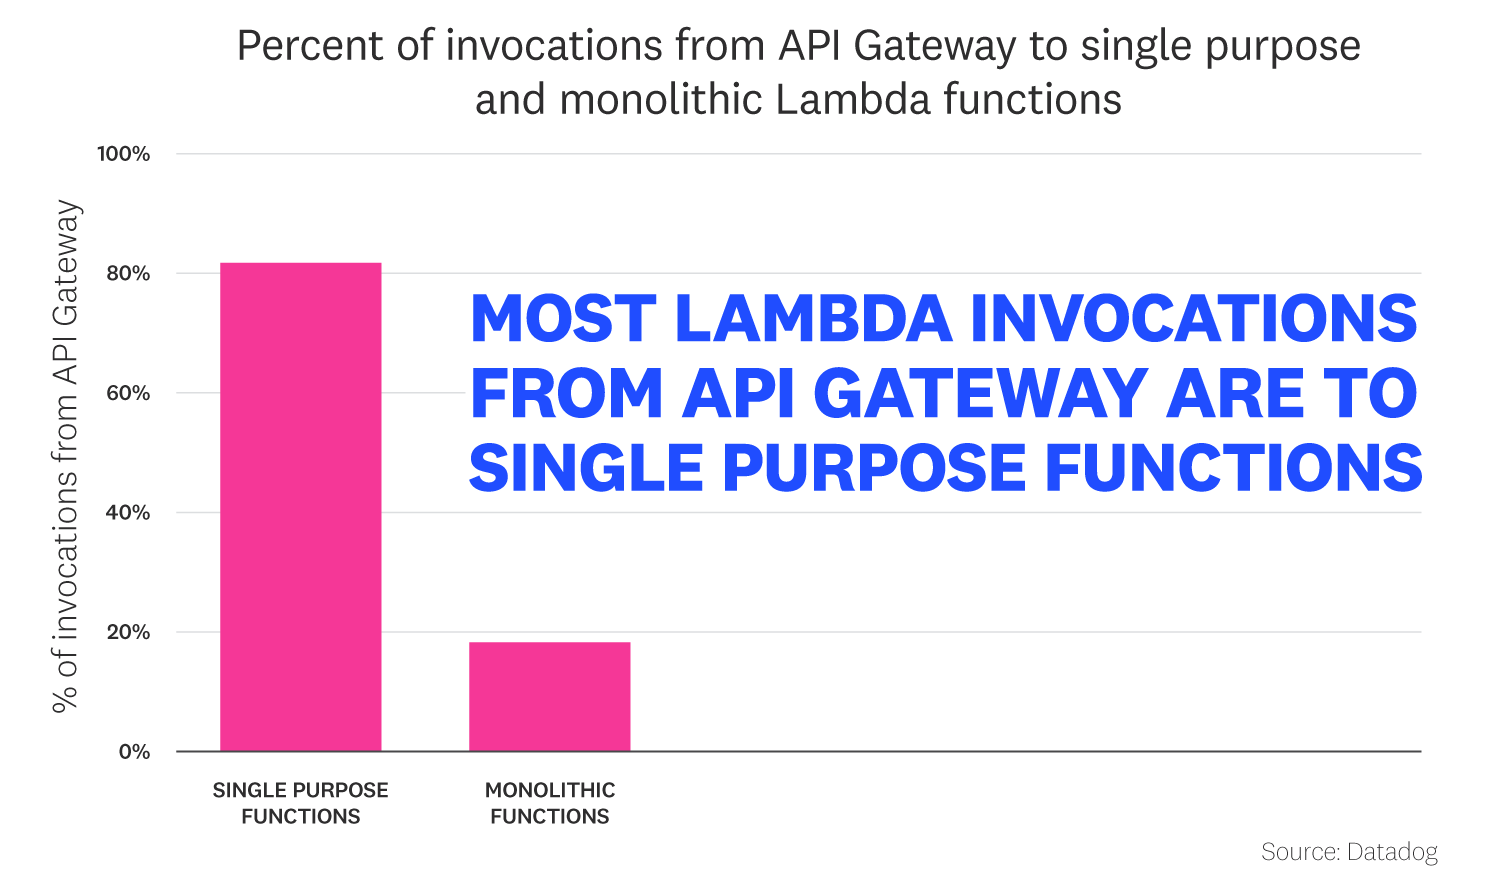
Solution: I developed a system that separates the graphs from the callout copy, adding structure to the visuals. The callout is now highlighted with a vibrant background, enhancing readability. I also incorporated brighter colors and gradients, which are key elements of the brand’s visual language.
Product Illustrations
I collaborate with Datadog’s product teams to create various illustration assets that enhance user experience within the Datadog product. This includes designing widget icons for our dashboards, crafting engaging empty state illustrations, and developing other visual assets that help communicate key features and functionality. These illustrations effectively engages users and improve their overall interaction with the platform.


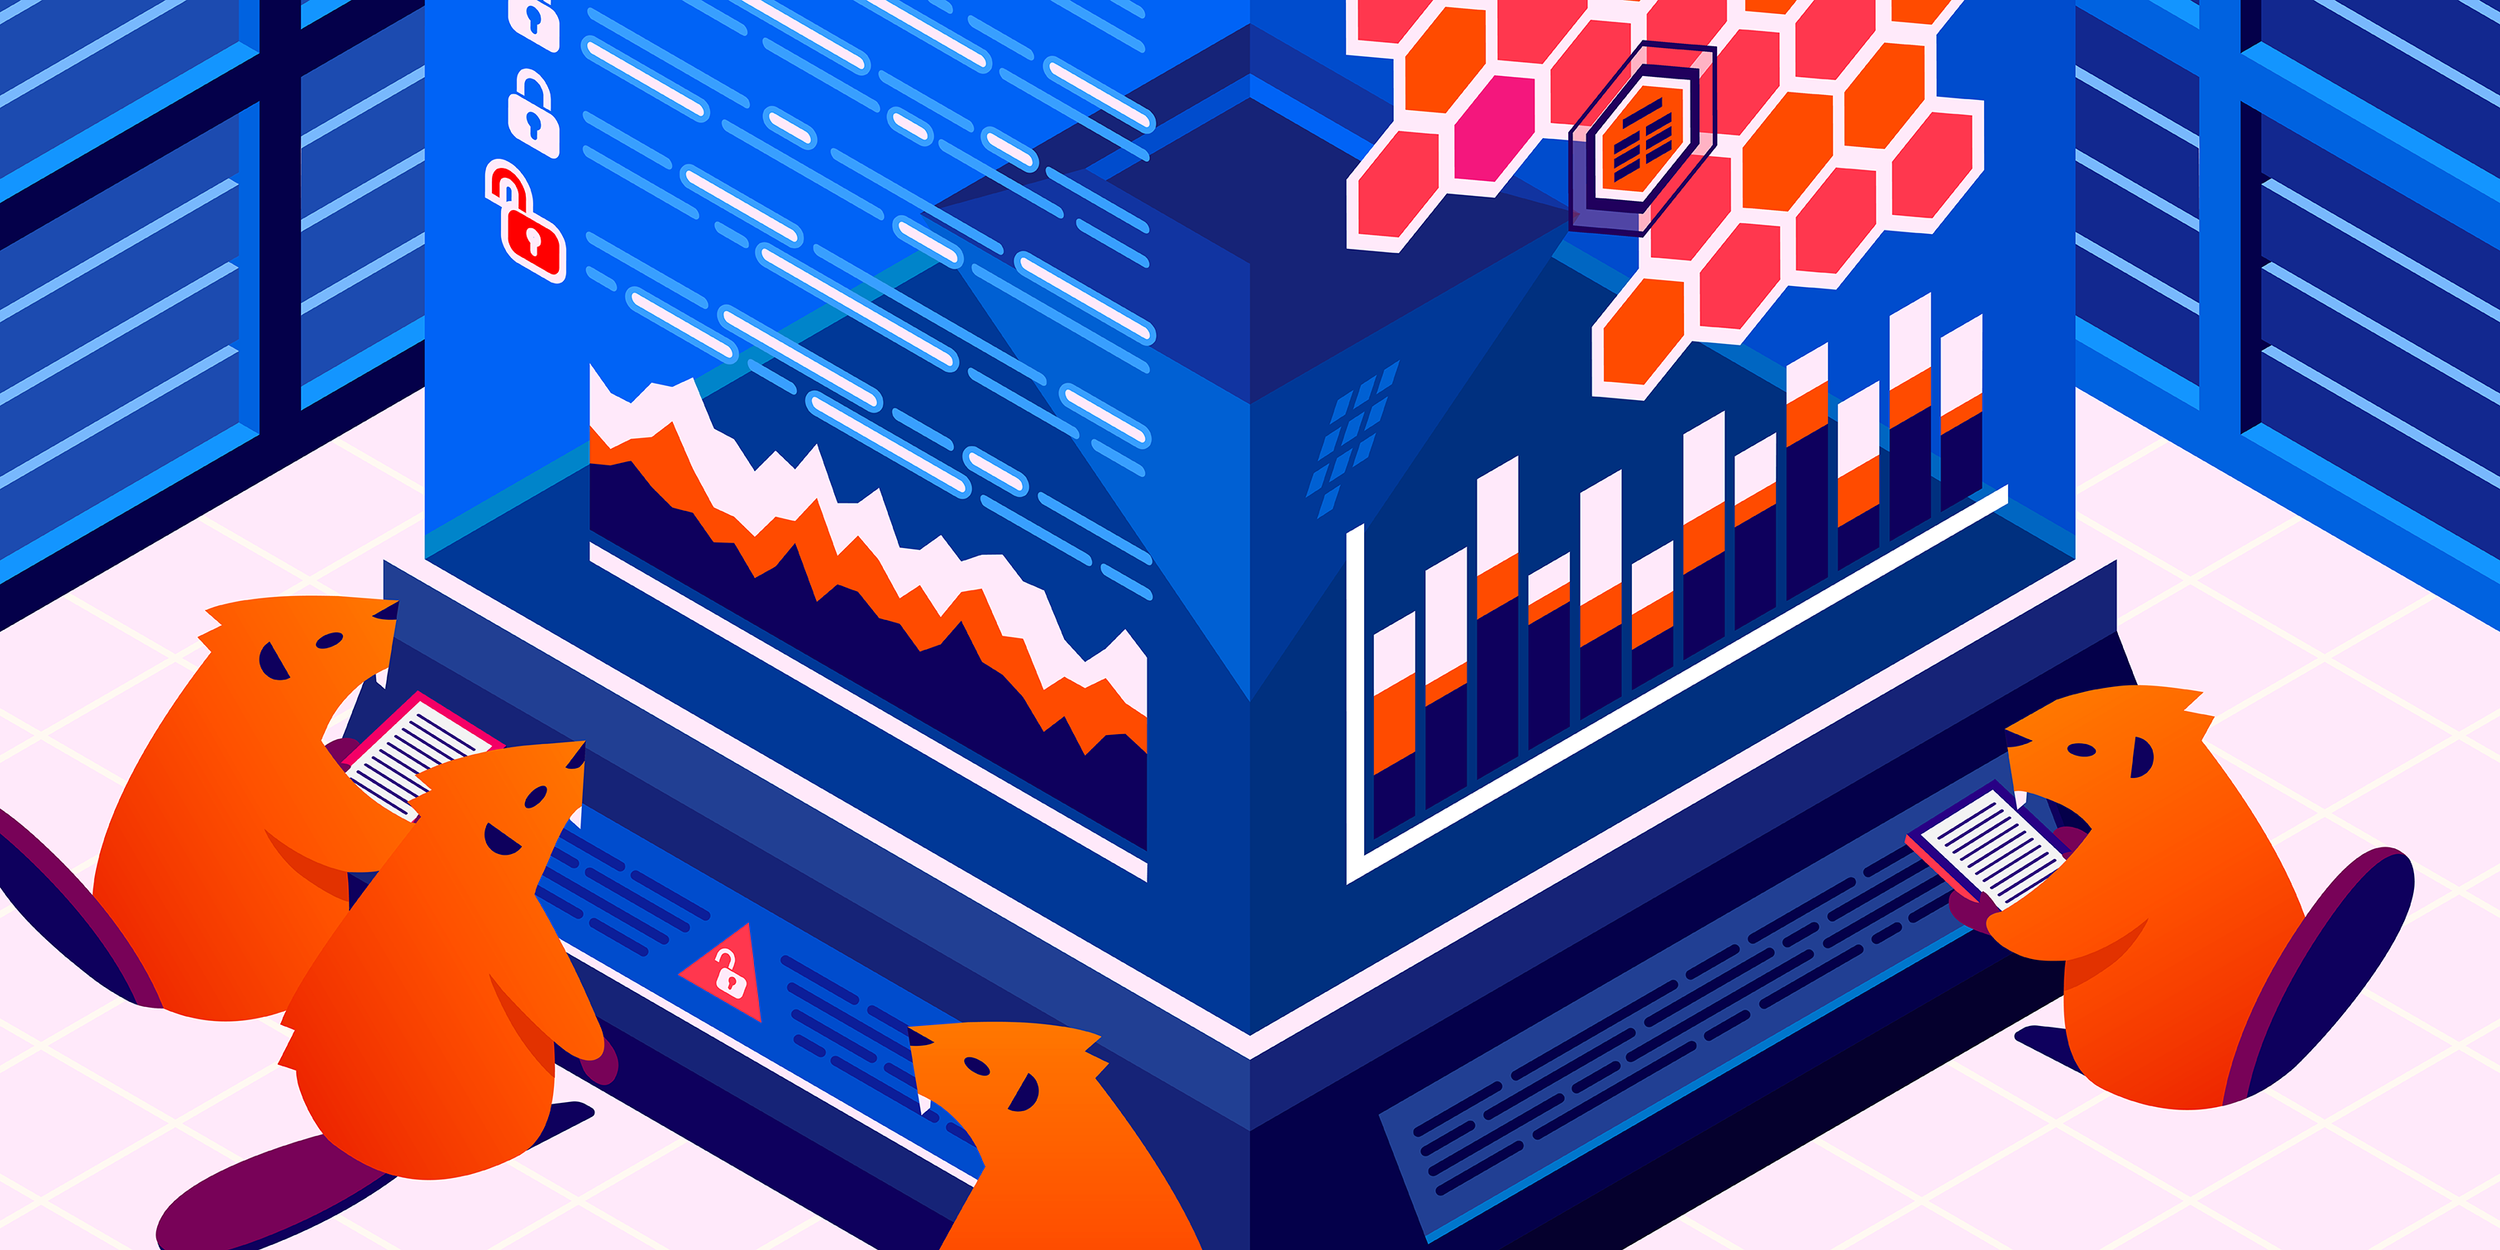
Editorial Hero Illustrations
Blog illustrations are essential for Datadog as they enhance content engagement, clarify complex technical concepts, and reinforce the brand's identity. I collaborate with Datadog’s writing team to create editorial illustrations for the company’s blog content. I transforms complex topics into visually engaging artwork, making technical concepts accessible and captivating.